

Would you invest your hard earned money into something that historically underperforms the market? Chances are you would laugh at such a question. Who wants to buy anything that has a long-term history of not performing well compared to a benchmark?
According to statistics from the Investment Company Institute, over 95.8 million individuals currently own investments that struggle to beat a relative benchmark. This means the investments held by 95.8 million people are underperforming the markets. The total of these investments is over $20 trillion. Most investors are shocked when they hear these statistics and even more so when they learn that the underperforming investments are actively managed mutual funds.
Below is a breakdown illustrating 1, 5 and 15-year performance of actively managed mutual funds compared to a benchmark (S&P 500, S&P Mid-Cap 400 and S&P Small-Cap 600). The numbers are a bit shocking, particularly the farther out you go. Essentially in the first year, less than half of the funds will beat their index. Go out to five years and it is over 80% and then after 15 years it is well over 90%.
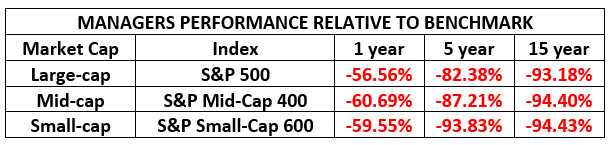
This data is provided in the 2017 mid-year SPIVA, a group whose mission is to, “bring independent, transparent and cost effective solutions to the global investment community.” They are a leader in research and educating investors regarding the difference between active and passive (index based) investing.
The debate between passive and active investing has been taking place for decades. In very simplistic terms passive investing is buying an index that is not actively managed (for example the S&P 500), active investing is when a manager or team is buying and selling equities in an effort to beat a specific index. Take a look again at the chart above to see how effective these managers have been!
While the performance compared to a benchmark is shocking, what many investors don’t realize is that they are also paying significant fees for this underperformance.
“On the whole, expense ratios range from as low as 0.25% (usually for
passive index funds) to as high as 2% or more for active specialty
strategies. The average equity mutual fund charges around 1.3%-1.5%.
You’ll generally pay more for niche or international funds, which
require more expertise from managers or funds that trade in illiquid
markets which imply greater transaction costs.” – Investopedia
If you own mutual funds in your portfolio we encourage you to take a look not only at the performance but the fees as well. If you need help, we encourage you to contact us and allow us to give you a complimentary review of your funds. As a firm, we do not buy actively managed mutual funds in our client’s portfolios. We firmly believe that we can build customized portfolios that will perform far better and at a significantly lower expense to our clients. Let us know how we can help you get back on track!
Mutual Fund Performances – Are Yours Delivering?